Fun with Sets in Tableau

So I love Tableau and I also hold it to a very high standard – static parameters and sets always stick out like a sore thumb, because these objects have so much potential. The lords of Tableau probably heard us (me and many others like me) curse every time we sat across a dashboard consumer who wanted their dashboard to open with the current year or month or date. As a result, parameters and sets in Tableau have evolved greatly in the past few releases. So let’s dive in to check out what is possible so far in Tableau 2020.2. I am loving the dynamic parameters and sets, and I will explain the best uses I have made out of them in the past six months. All the dashboards can be downloaded from Tableau Public.
1 - Dynamic filter with multi-value selection
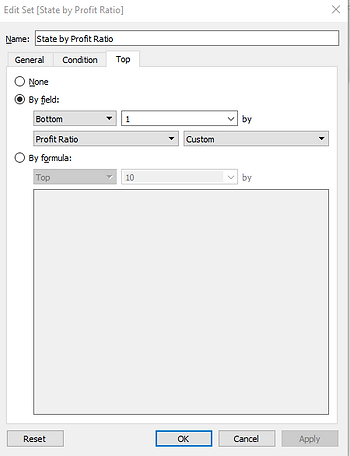
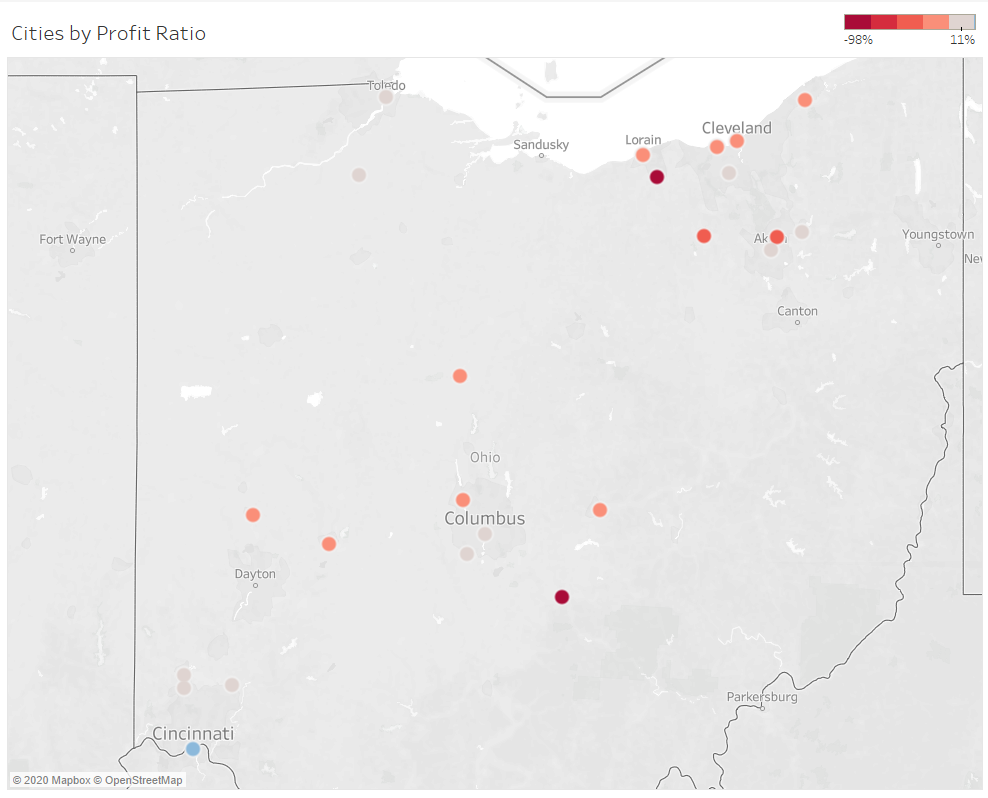
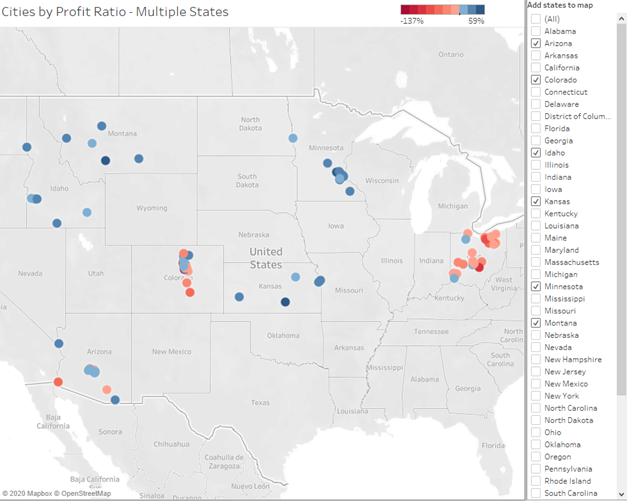
We are analyzing the Super Store data and the Sales manager wants to look at the Profit Ratio by city, for the state that has the lowest Profit Ratio. We can accomplish this by creating a set and filtering our view with this set.
At this moment, this state happens to be Ohio, so this is what our viz (and dashboard) will be showing.
When the user opens the same dashboard the next day, depending on the new records that have been added to the data source, the user will see that state with the lowest profit ratio.
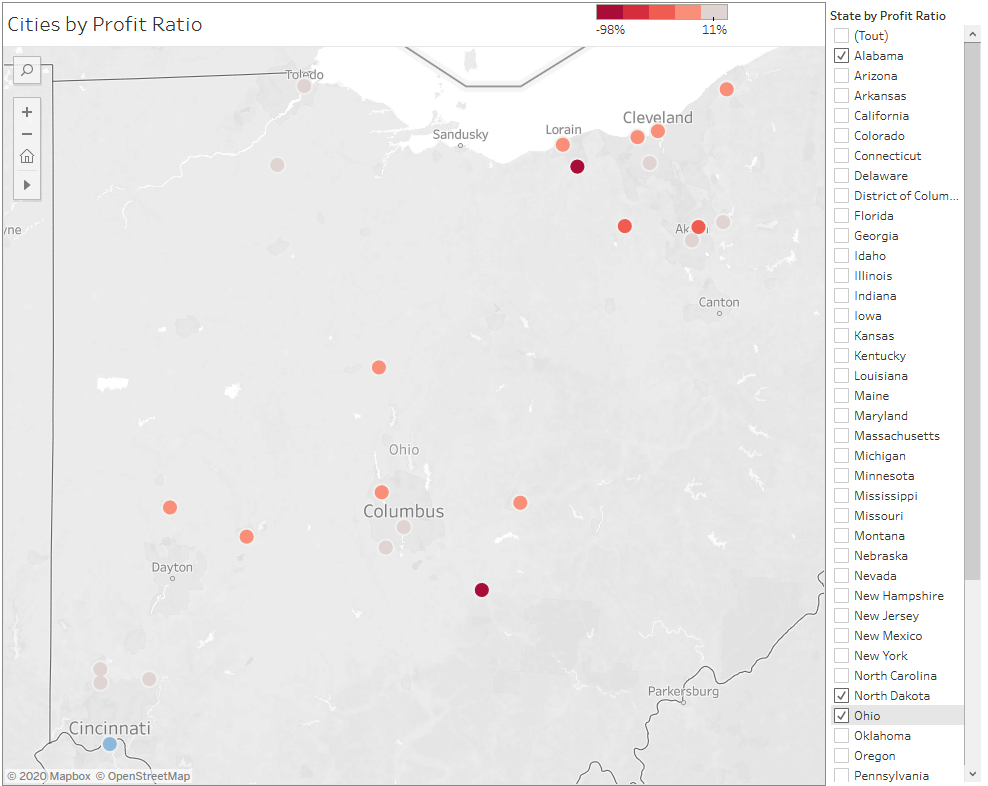
What if we want to allow the user to change which state is being shown regardless of the profit ratio of the state? You can show the Set on the dashboard and it appears as a quick filter. This trick will only work if you select only one State in the menu. If you select multiple state, the viz will show the one with the lowest Profit Ratio. The reason is that this set has been constructed to have only one member (Bottom 1 by Profit Ratio).
A work around can be to modify this set and allow say 5 bottom states by Profit Ratio in the definition of the set. Then, you will be able to show maximum 5 states using the menu but the downside is that when you open the dashboard, you will also see 5 states in the viz, which is not the requirement.
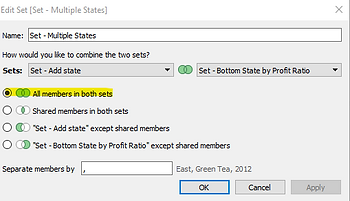
To construct our viz that starts out on a single state (minimum Profit Ratio) and lets us select multiple states, we will need to create two more sets based on State. We will call one of them ‘Set – Add State’ and by default, we will leave it empty:

We will then create a combined set which will be based on the original set (bottom state by profit) and the empty set we just created, and we will use the option ‘All members in both sets’ to combine them.
We can now filter our viz using the new combined set. The advantage of this technique is that we can add any number of states to the set ‘Set – Add states’ while our original set will continue to contain the bottom state by Profit Ratio. You can achieve the final result by simply adding the set ‘Set – Add state’ to the detail pane of your viz and showing the set in the dashboard.
2 - Drill down in a secondary source
Very often we are in an environment where we work with data sources published on Tableau Server. While this is the best practice and I congratulate organisations that have been able to implement this practice, this makes creating ‘joins’ impossible. The only way to combine information from two published data sources is to blend them. Blends work wonderfully for many cases but they have two limitations
1. Performance
2. Cannot drill down in the secondary data source
Let us create an example using our beloved Super Store data. We have created the following viz that shows states by their profit ratio for the entire country of the United States.
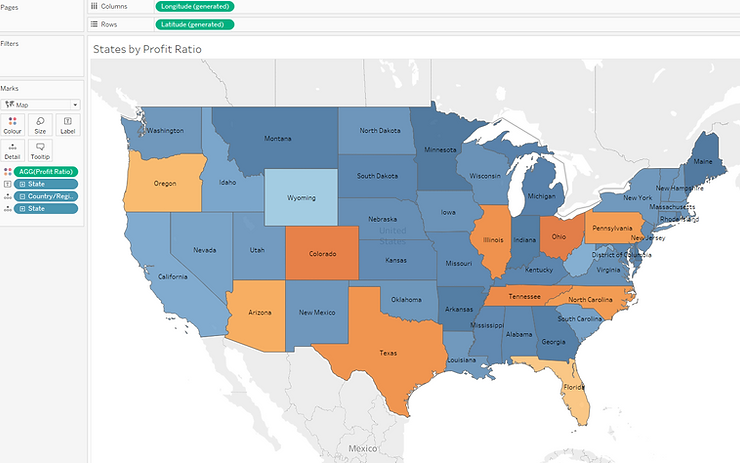
We could like to complement the information in our Super Store dataset with another data source that contains the names of the Chief Sales Representatives in each state.
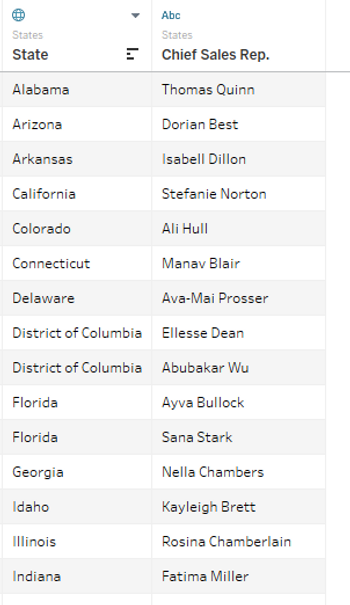
Easy, we can blend the two data source on the column ‘State’. With the blend, we then bring ATTR(Chief Sales rep.) to the tooltip. We have a problem because some states (Washington, Texas among others) are showing a (*). This is because this state has two persons assigned for this role. With the blend, the only option is to use MIN or MAX instead of ATTR, but this would bring only one person’s name into our tooltip.

We can show the full list of representatives from the secondary source by using parameters. First, create a parameter of type String and chose ‘All’ values to be allowable. Then, in the source that contains the list of States and their sales representatives, create a calculated field with the following formula:
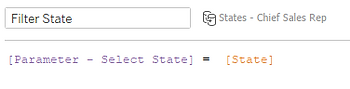
Create a new sheet with the list of names of representatives and use the above field as a filter on this sheet. Use this sheet in the tooltip of the sheet where you have the map.
Bring the map to a dashboard and add a dashboard action to update the parameter value:
The tooltip in the dashboard will now display the full list of sales representatives instead of the (*) as in the case of a blend. Try hovering over Washington or Texas in the viz below:
This trick can be used to avoid blends in many other situations, where the requirement is such that you can show information from two data sources on different sheets. You can also use sets instead of parameters where you need to "drill-down" the secondary source based on multiple selections on the primary source.
3 - Count objects with specific characteristics in two different data sources
We will again set up the example using the Super Store data. We also have another published data source that contains information about products that have been marked to be discontinued. The data source has the following content:
We are building a dashboard to analyze if indeed the poorly performing products have been marked for discontinuation. We first build a sheet with the Sales on bars and profit on colour. We also prepare some indicators summarizing the number of unprofitable products (which we calculate in the Super Store data source) and the number of products marked for discontinuation (which we calculate in the other published data source). We also want to show the number of unprofitable products that are marked for discontinuation and the number of profitable ones marked for discontinuation. The last two numbers are impossible to calculate using a blend. We will compute them using set actions.
We need to first create two sets in the Super Store data source. One will consist of all unprofitable products. In the other set, “marked for discontinuation”, we will check the option 'None' as default. It is this set that we will modify using a set action. For the action to happen we need to create another sheet that will server to trigger the action.
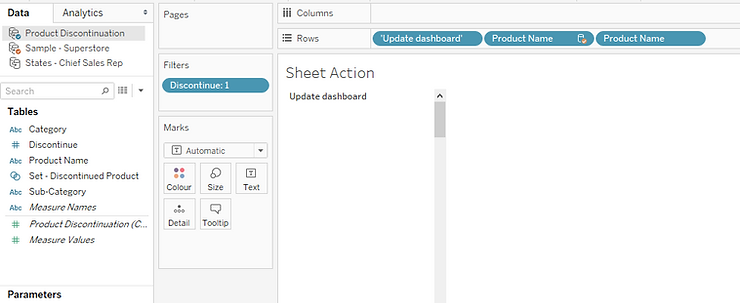
The following figure shows the setup of this sheet. We create a dummy dimension ‘Update dashboard’ to show a value where the user will ‘click’. Keep in mind that in this sheet, the primary source is the Product discontinuation data source and that Super Store is the secondary source.
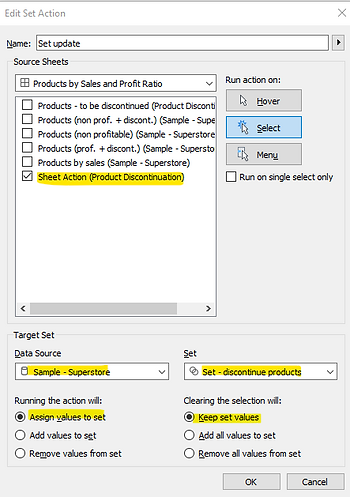
We bring this sheet to our dashboard, re-dimension it so that only the words ‘Update dashboard’ are showing, and add a dashboard action as follows:
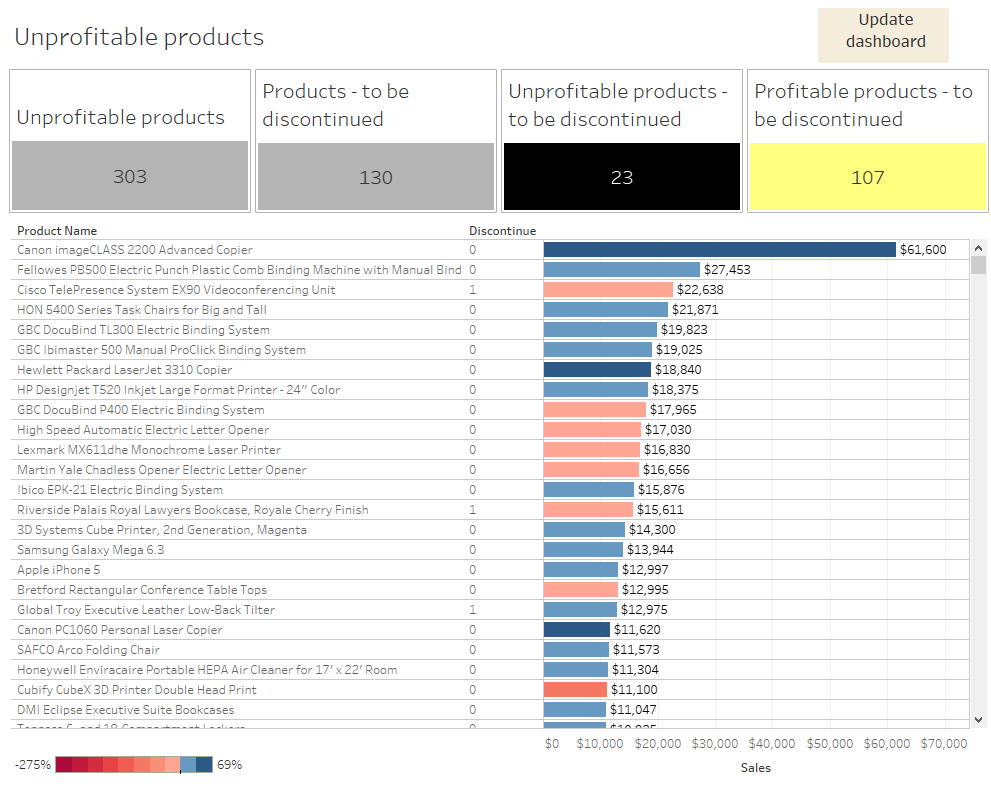
We then create two new indicators (sheets) where we count the number of products that are in both sets (unprofitable and to be discontinued) and in one of them (profitable and to be discontinued). These sheets will update after the addition of the action sheet and the triggering of the action. The final dashboard is shown below. Click on 'Update dashboard' to animate the last two indicators !
I hope you enjoyed this post as much as I enjoy the new set and parameters functionalities in Tableau. All the dashboards can be downloaded from Tableau Public. For any questions or feedback, please do not hesitate to write to us at info@argusa.ch.
So I love Tableau and I also hold it to a very high standard – static parameters and sets always stick out like a sore thumb, because these objects have so much potential. The lords of Tableau probably heard us (me and many others like me) curse every time we sat across a dashboard consumer who wanted their dashboard to open with the current year or month or date. As a result, parameters and sets in Tableau have evolved greatly in the past few releases. So let’s dive in to check out what is possible so far in Tableau 2020.2. I am loving the dynamic parameters and sets, and I will explain the best uses I have made out of them in the past six months. All the dashboards can be downloaded from Tableau Public.
1 - Dynamic filter with multi-value selection
We are analyzing the Super Store data and the Sales manager wants to look at the Profit Ratio by city, for the state that has the lowest Profit Ratio. We can accomplish this by creating a set and filtering our view with this set.
At this moment, this state happens to be Ohio, so this is what our viz (and dashboard) will be showing.
When the user opens the same dashboard the next day, depending on the new records that have been added to the data source, the user will see that state with the lowest profit ratio.
What if we want to allow the user to change which state is being shown regardless of the profit ratio of the state? You can show the Set on the dashboard and it appears as a quick filter. This trick will only work if you select only one State in the menu. If you select multiple state, the viz will show the one with the lowest Profit Ratio. The reason is that this set has been constructed to have only one member (Bottom 1 by Profit Ratio).
A work around can be to modify this set and allow say 5 bottom states by Profit Ratio in the definition of the set. Then, you will be able to show maximum 5 states using the menu but the downside is that when you open the dashboard, you will also see 5 states in the viz, which is not the requirement.
To construct our viz that starts out on a single state (minimum Profit Ratio) and lets us select multiple states, we will need to create two more sets based on State. We will call one of them ‘Set – Add State’ and by default, we will leave it empty:
We will then create a combined set which will be based on the original set (bottom state by profit) and the empty set we just created, and we will use the option ‘All members in both sets’ to combine them.
We can now filter our viz using the new combined set. The advantage of this technique is that we can add any number of states to the set ‘Set – Add states’ while our original set will continue to contain the bottom state by Profit Ratio. You can achieve the final result by simply adding the set ‘Set – Add state’ to the detail pane of your viz and showing the set in the dashboard.
2 - Drill down in a secondary source
Very often we are in an environment where we work with data sources published on Tableau Server. While this is the best practice and I congratulate organisations that have been able to implement this practice, this makes creating ‘joins’ impossible. The only way to combine information from two published data sources is to blend them. Blends work wonderfully for many cases but they have two limitations
1. Performance
2. Cannot drill down in the secondary data source
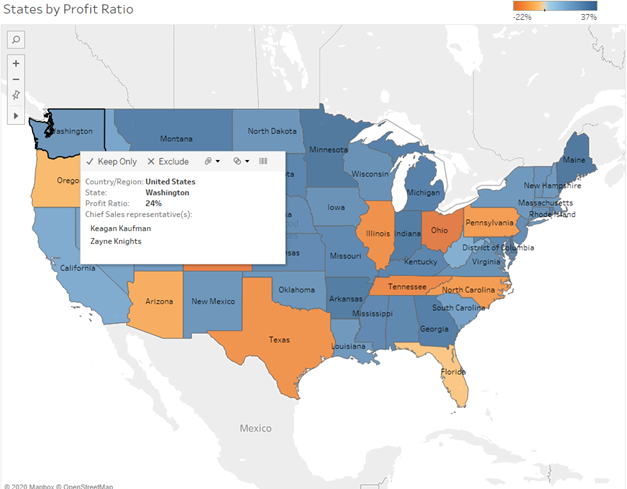
Let us create an example using our beloved Super Store data. We have created the following viz that shows states by their profit ratio for the entire country of the United States.
We could like to complement the information in our Super Store dataset with another data source that contains the names of the Chief Sales Representatives in each state.
Easy, we can blend the two data source on the column ‘State’. With the blend, we then bring ATTR(Chief Sales rep.) to the tooltip. We have a problem because some states (Washington, Texas among others) are showing a (*). This is because this state has two persons assigned for this role. With the blend, the only option is to use MIN or MAX instead of ATTR, but this would bring only one person’s name into our tooltip.
We can show the full list of representatives from the secondary source by using parameters. First, create a parameter of type String and chose ‘All’ values to be allowable. Then, in the source that contains the list of States and their sales representatives, create a calculated field with the following formula:
Create a new sheet with the list of names of representatives and use the above field as a filter on this sheet. Use this sheet in the tooltip of the sheet where you have the map.
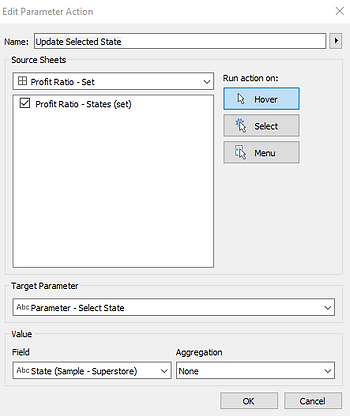
Bring the map to a dashboard and add a dashboard action to update the parameter value:
The tooltip in the dashboard will now display the full list of sales representatives instead of the (*) as in the case of a blend. Try hovering over Washington or Texas in the viz below:
This trick can be used to avoid blends in many other situations, where the requirement is such that you can show information from two data sources on different sheets. You can also use sets instead of parameters where you need to "drill-down" the secondary source based on multiple selections on the primary source.
3 - Count objects with specific characteristics in two different data sources
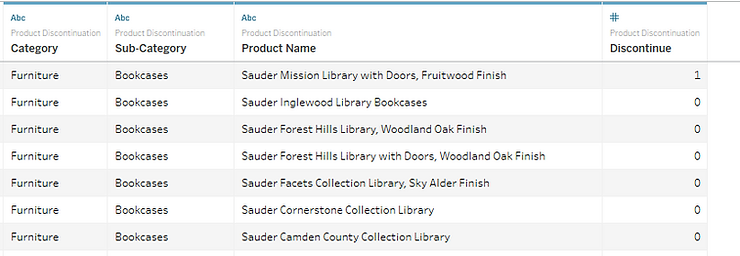
We will again set up the example using the Super Store data. We also have another published data source that contains information about products that have been marked to be discontinued. The data source has the following content:
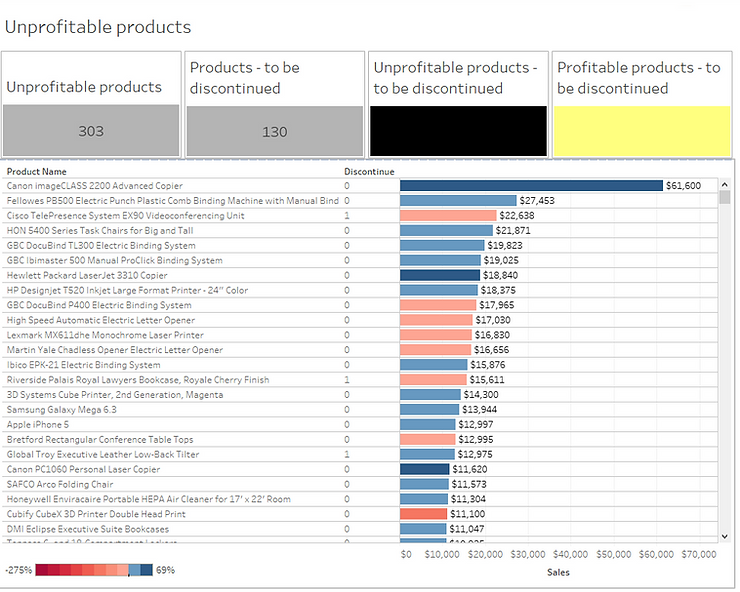
We are building a dashboard to analyze if indeed the poorly performing products have been marked for discontinuation. We first build a sheet with the Sales on bars and profit on colour. We also prepare some indicators summarizing the number of unprofitable products (which we calculate in the Super Store data source) and the number of products marked for discontinuation (which we calculate in the other published data source). We also want to show the number of unprofitable products that are marked for discontinuation and the number of profitable ones marked for discontinuation. The last two numbers are impossible to calculate using a blend. We will compute them using set actions.
We need to first create two sets in the Super Store data source. One will consist of all unprofitable products. In the other set, “marked for discontinuation”, we will check the option 'None' as default. It is this set that we will modify using a set action. For the action to happen we need to create another sheet that will server to trigger the action.
The following figure shows the setup of this sheet. We create a dummy dimension ‘Update dashboard’ to show a value where the user will ‘click’. Keep in mind that in this sheet, the primary source is the Product discontinuation data source and that Super Store is the secondary source.
We bring this sheet to our dashboard, re-dimension it so that only the words ‘Update dashboard’ are showing, and add a dashboard action as follows:
We then create two new indicators (sheets) where we count the number of products that are in both sets (unprofitable and to be discontinued) and in one of them (profitable and to be discontinued). These sheets will update after the addition of the action sheet and the triggering of the action. The final dashboard is shown below. Click on 'Update dashboard' to animate the last two indicators !
I hope you enjoyed this post as much as I enjoy the new set and parameters functionalities in Tableau. All the dashboards can be downloaded from Tableau Public. For any questions or feedback, please do not hesitate to write to us at info@argusa.ch.