Building relationships: Tableau’s new data model

Solving business problems likely requires you to combine data from multiple sources. More often than not, those sources are quite different and do not even exist in the same database.
Combining complex data in Tableau is not always straightforward. For example, you may find that a join is the perfect solution for one specific viz, but makes other analysis on the same data too complicated. Alternatively, you may decide to blend your data, only to discover that your dashboards take a long time to load.
Finding the best way to combine data in Tableau depends on what you are trying to achieve. Therefore, you may find yourself having to create and maintain several data sources, with different combinations of the same data.
To simplify and streamline the data combination process, Tableau developed a completely new data model. This model was just released with version 2020.2 of Tableau Desktop. Here we will show, using a simple example, how Tableau’s new data model makes data combination easier, faster, more flexible and more powerful, when compared to traditional blends or joins.
Let us consider a simple example based on Tableau’s Superstore dataset. Suppose we have been analyzing the sales data of our Superstore, which can be found in an “Orders” table such as this:
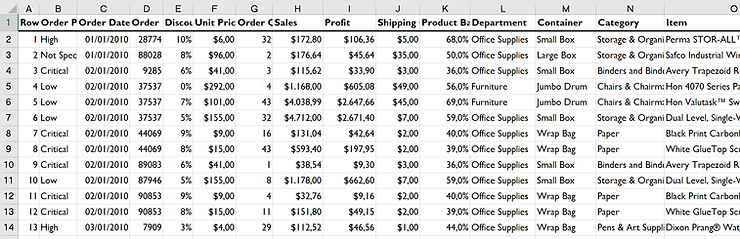
It is important to establish the level of detail, or granularity, of this dataset. In particular, note that each row in this table represents one unique order placed with the Superstore.
We have been asked to build a viz that shows if the Superstore is meeting its sales goals. For that, we were given a simple “Targets” file that looks like this:
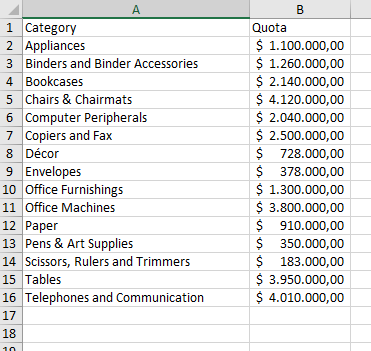
Also here, it is important to note the level of detail of this dataset, especially because it is different from the previous one: each row has the sales Quota for a single Category.
So how can we combine this data in Tableau to build our viz?
Option 1: Join
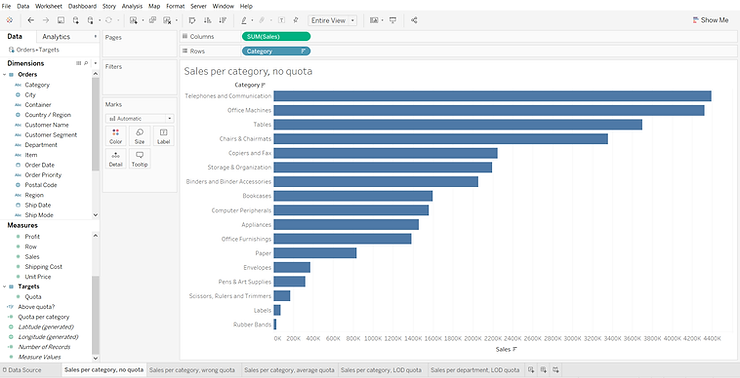
The two tables have one common dimension - “Category” - so we can join them over this common field. Here we opted for a left join, such that we can look into sales for categories that may not have an established quota. This is what a simple viz of the sales per category looks like:
And once we display the quota as a reference line this is what we get:
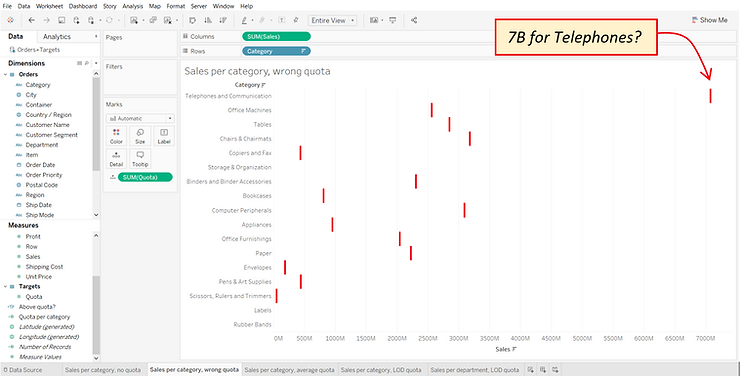
These numbers look wrong. Looking at the raw data, our goal for Telephones is ~4M, not ~7B as shown here. So what happened?
As we previously noted, the level of detail of each table is different. Therefore, when we joined them to create a combined table, we duplicated the quotas on different rows (or different orders under the same category):
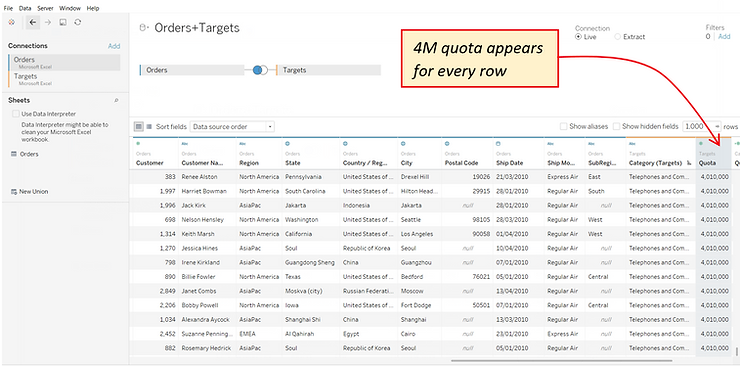
When bringing the Quota field into the view, Tableau automatically aggregated it by summing the quota for all rows with the same Category. As a result, the quota for Telephones is no longer ~4M, but 4M times the number of Telephone orders.
One way to fix the issue is to simply change the aggregation performed on Quota, from the default sum to, for example, an average. But that will only work as long as the level of detail of your view is still Category. For example, if we are asked whether each Department is meeting their sales quota, we will find that the quotas displayed will be incorrect once again.
In this case, what we need is an LOD calculation, to fix the quota value to each category:

If we use this LOD calculation for the Reference Line we get:
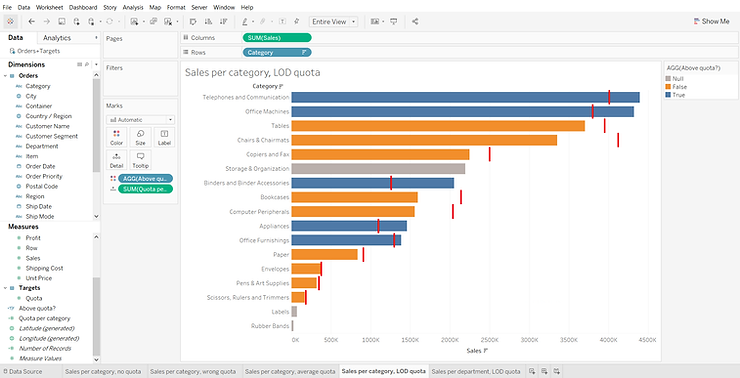
(We also created a simple calculated field to compare the sales with the quota and dragged it to color)
And the view will still be correct if we look at the department, instead of the Category:

In the end we achieved our goal by using a join and an LOD calculation, which may not look too complicated in this simple example, but figuring out exactly which LOD calculation you need to write can become a complex task.
Option 2: Blend
To blend data in Tableau, you first create two separate data sources - in our example one for “Orders” (primary data source) and one for “Targets” (secondary data source). You must then define a linking field between the data sources – in our case “Category”. Tableau will then query each table separately and display the results of the query together in the viz. Note that this is different from a join, where the combined data is queried. The advantage of blending the data is that you can emulate the behavior of a left join without the duplication. By blending the data in our two tables, we can create the desired viz without using complicated LOD calculations:
Clearly data blending is a very powerful feature. However, keep in mind that Tableau is querying each data source separately, at the level of the linking field, and then computing the blend locally. For this reason, the performance of your viz can degrade quickly when you use data blending, especially when you are blending on a field with high cardinality (i.e. many unique values).
Option 3: Relationship
If we try to combine our Orders and Targets tables in the new Tableau Desktop version 2020.2, here is what we will see by default:
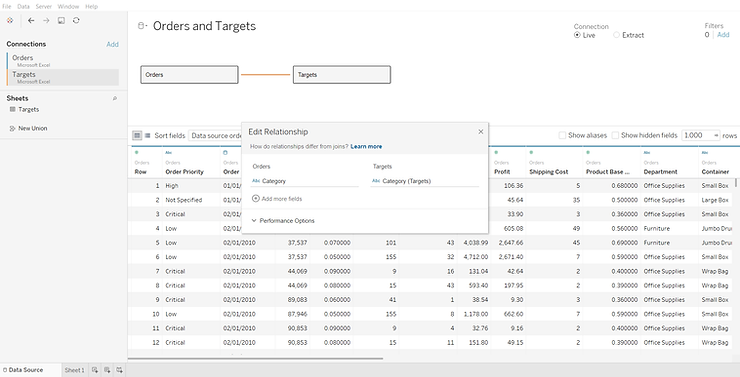
We are looking at Tableau’s new data model at play. Tableau has automatically identified the common Category field, and created a relationship between the two tables based on that field. The straight line between the tables, or the so-called “noodle”, represents the relationship. Please note that Tableau simply established a relationship between the tables, but did not combine them (yet). For that reason, we can only see the data for each table individually (only columns from the Orders table appear in the screenshot above).
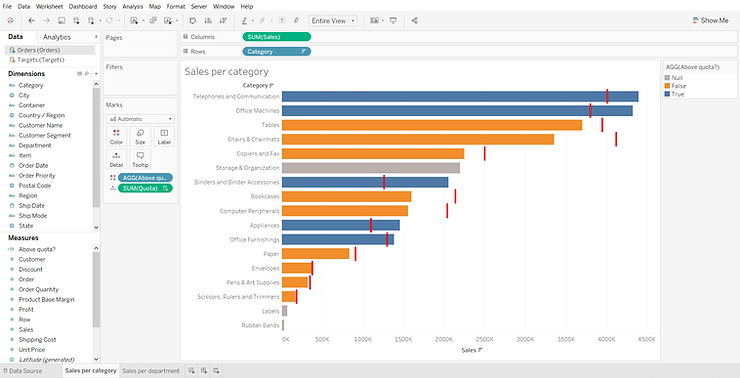
With Tableau’s new data model, each related table maintains its native level of detail. This means that we can, again, build our viz without creating complicated calculations, simply by dragging and dropping existing fields:
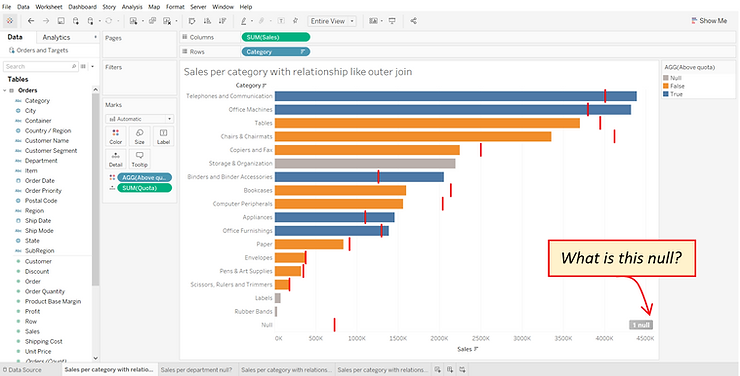
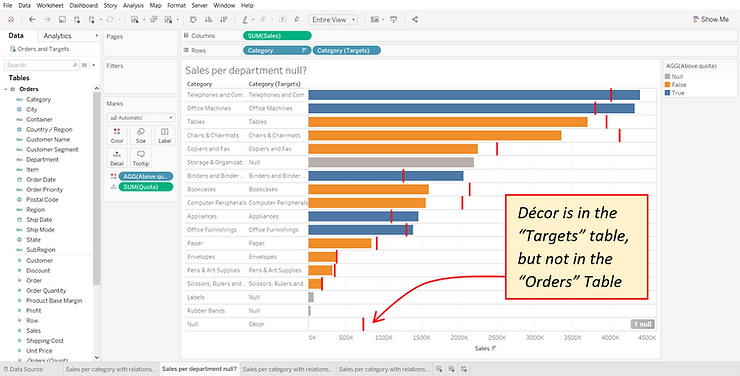
But wait, there’s a null we didn’t see before, what is that? This null represents a Category for which we have a sales target, but no actual sales. This is an insight we were not able to obtain previously, because we opted either for a left join or for a blend to combine our data. We can add the Category dimension from the Target table to the view, to see that we have no Sales in the Décor Category:
What if we are not interested in Categories with no sales? Then, we can simply right click the Décor label in the view and exclude it. This will result in a filter appearing in the view. A filter may seem like a simple thing, but this filter is actually quite powerful, because it is acting as a different join type.
Our initial viz showed us all the data, like an outer join. Then we excluded values from the Targets table that do not have matches in the Orders table, effectively creating a left join. We could have also excluded those categories appearing in gray, that to not have a sales target, and we would have found ourselves with an inner join. Except we never had to create those joins or worry about possible duplication and complicated LOD calculations.
At this point you might be thinking – not worrying about possible duplication or LOD calculations still sounds like data blending, is that what is happening? The answer is no. To do data blending in Tableau you need to define separate data sources and decide on a primary and a secondary one. Tableau then queries the data sources separately and performs the combination (blending) locally, which is why the performance can degrade easily. However, with relationships, the combination (join) is executed as part of the query. Furthermore, you do not need to define multiple data sources or choose which one is primary. With relationships all tables are created equal, and you can create many-to-many relationships between tables.
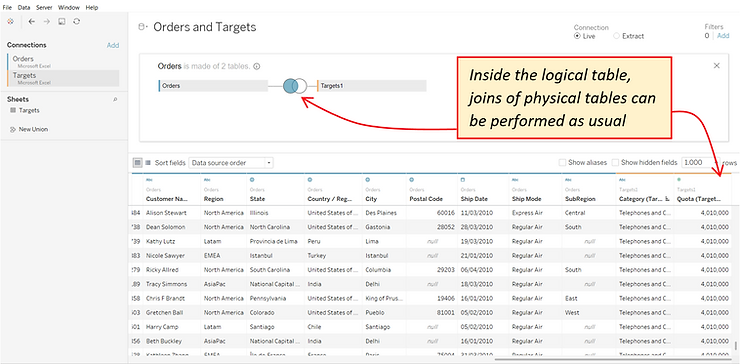
This sounds great, but I really want a join, can I just do that? Yes, you can. Relationships are actually created between logical tables, which are like containers of physical tables.
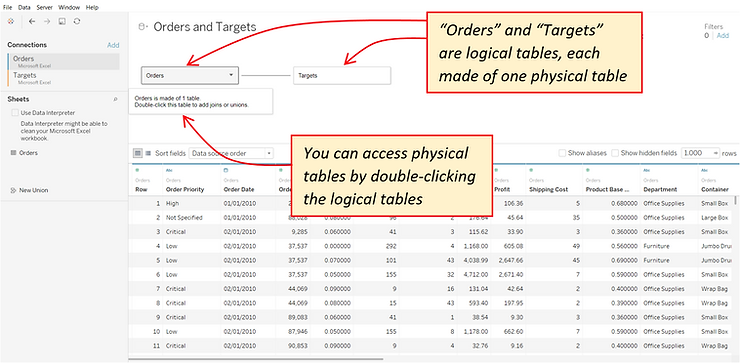
If you double-click a logical table you will gain access to the physical table, with which you can perform traditional joins just like before.
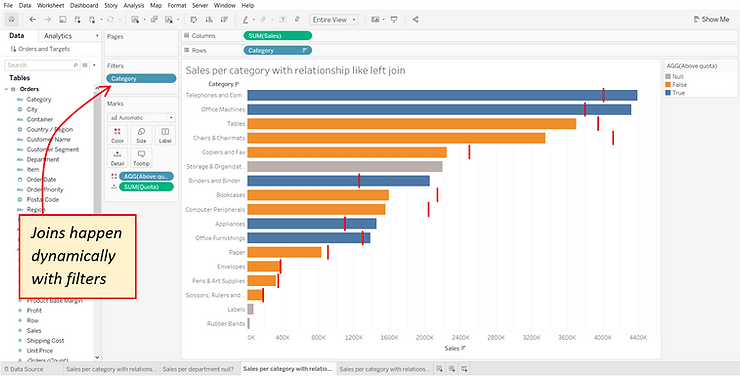
In summary, Tableau’s new data model greatly simplifies the data combination process. We no longer need to decide how to combine our data in advance. We can simply create relationships between our tables, and let the combination happen dynamically depending on what we were adding to our view. This new approach results in more powerful and flexible data sources, simpler queries, and overall better performance.
Solving business problems likely requires you to combine data from multiple sources. More often than not, those sources are quite different and do not even exist in the same database.
Combining complex data in Tableau is not always straightforward. For example, you may find that a join is the perfect solution for one specific viz, but makes other analysis on the same data too complicated. Alternatively, you may decide to blend your data, only to discover that your dashboards take a long time to load.
Finding the best way to combine data in Tableau depends on what you are trying to achieve. Therefore, you may find yourself having to create and maintain several data sources, with different combinations of the same data.
To simplify and streamline the data combination process, Tableau developed a completely new data model. This model was just released with version 2020.2 of Tableau Desktop. Here we will show, using a simple example, how Tableau’s new data model makes data combination easier, faster, more flexible and more powerful, when compared to traditional blends or joins.
Let us consider a simple example based on Tableau’s Superstore dataset. Suppose we have been analyzing the sales data of our Superstore, which can be found in an “Orders” table such as this:
It is important to establish the level of detail, or granularity, of this dataset. In particular, note that each row in this table represents one unique order placed with the Superstore.
We have been asked to build a viz that shows if the Superstore is meeting its sales goals. For that, we were given a simple “Targets” file that looks like this:
Also here, it is important to note the level of detail of this dataset, especially because it is different from the previous one: each row has the sales Quota for a single Category.
So how can we combine this data in Tableau to build our viz?
Option 1: Join
The two tables have one common dimension - “Category” - so we can join them over this common field. Here we opted for a left join, such that we can look into sales for categories that may not have an established quota. This is what a simple viz of the sales per category looks like:
And once we display the quota as a reference line this is what we get:
These numbers look wrong. Looking at the raw data, our goal for Telephones is ~4M, not ~7B as shown here. So what happened?
As we previously noted, the level of detail of each table is different. Therefore, when we joined them to create a combined table, we duplicated the quotas on different rows (or different orders under the same category):
When bringing the Quota field into the view, Tableau automatically aggregated it by summing the quota for all rows with the same Category. As a result, the quota for Telephones is no longer ~4M, but 4M times the number of Telephone orders.
One way to fix the issue is to simply change the aggregation performed on Quota, from the default sum to, for example, an average. But that will only work as long as the level of detail of your view is still Category. For example, if we are asked whether each Department is meeting their sales quota, we will find that the quotas displayed will be incorrect once again.
In this case, what we need is an LOD calculation, to fix the quota value to each category:
If we use this LOD calculation for the Reference Line we get:
(We also created a simple calculated field to compare the sales with the quota and dragged it to color)
And the view will still be correct if we look at the department, instead of the Category:
In the end we achieved our goal by using a join and an LOD calculation, which may not look too complicated in this simple example, but figuring out exactly which LOD calculation you need to write can become a complex task.
Option 2: Blend
To blend data in Tableau, you first create two separate data sources - in our example one for “Orders” (primary data source) and one for “Targets” (secondary data source). You must then define a linking field between the data sources – in our case “Category”. Tableau will then query each table separately and display the results of the query together in the viz. Note that this is different from a join, where the combined data is queried. The advantage of blending the data is that you can emulate the behavior of a left join without the duplication. By blending the data in our two tables, we can create the desired viz without using complicated LOD calculations:
Clearly data blending is a very powerful feature. However, keep in mind that Tableau is querying each data source separately, at the level of the linking field, and then computing the blend locally. For this reason, the performance of your viz can degrade quickly when you use data blending, especially when you are blending on a field with high cardinality (i.e. many unique values).
Option 3: Relationship
If we try to combine our Orders and Targets tables in the new Tableau Desktop version 2020.2, here is what we will see by default:
We are looking at Tableau’s new data model at play. Tableau has automatically identified the common Category field, and created a relationship between the two tables based on that field. The straight line between the tables, or the so-called “noodle”, represents the relationship. Please note that Tableau simply established a relationship between the tables, but did not combine them (yet). For that reason, we can only see the data for each table individually (only columns from the Orders table appear in the screenshot above).
With Tableau’s new data model, each related table maintains its native level of detail. This means that we can, again, build our viz without creating complicated calculations, simply by dragging and dropping existing fields:
But wait, there’s a null we didn’t see before, what is that? This null represents a Category for which we have a sales target, but no actual sales. This is an insight we were not able to obtain previously, because we opted either for a left join or for a blend to combine our data. We can add the Category dimension from the Target table to the view, to see that we have no Sales in the Décor Category:
What if we are not interested in Categories with no sales? Then, we can simply right click the Décor label in the view and exclude it. This will result in a filter appearing in the view. A filter may seem like a simple thing, but this filter is actually quite powerful, because it is acting as a different join type.
Our initial viz showed us all the data, like an outer join. Then we excluded values from the Targets table that do not have matches in the Orders table, effectively creating a left join. We could have also excluded those categories appearing in gray, that to not have a sales target, and we would have found ourselves with an inner join. Except we never had to create those joins or worry about possible duplication and complicated LOD calculations.
At this point you might be thinking – not worrying about possible duplication or LOD calculations still sounds like data blending, is that what is happening? The answer is no. To do data blending in Tableau you need to define separate data sources and decide on a primary and a secondary one. Tableau then queries the data sources separately and performs the combination (blending) locally, which is why the performance can degrade easily. However, with relationships, the combination (join) is executed as part of the query. Furthermore, you do not need to define multiple data sources or choose which one is primary. With relationships all tables are created equal, and you can create many-to-many relationships between tables.
This sounds great, but I really want a join, can I just do that? Yes, you can. Relationships are actually created between logical tables, which are like containers of physical tables.
If you double-click a logical table you will gain access to the physical table, with which you can perform traditional joins just like before.
In summary, Tableau’s new data model greatly simplifies the data combination process. We no longer need to decide how to combine our data in advance. We can simply create relationships between our tables, and let the combination happen dynamically depending on what we were adding to our view. This new approach results in more powerful and flexible data sources, simpler queries, and overall better performance.