Bridging data and users with Streamlit apps

Introduction: The data complexity challenge
In today's data-driven landscape, the real problem is data quality and accessibility, way more than data scarcity. Organizations drown in information yet struggle to transform it into actionable insights for end users.
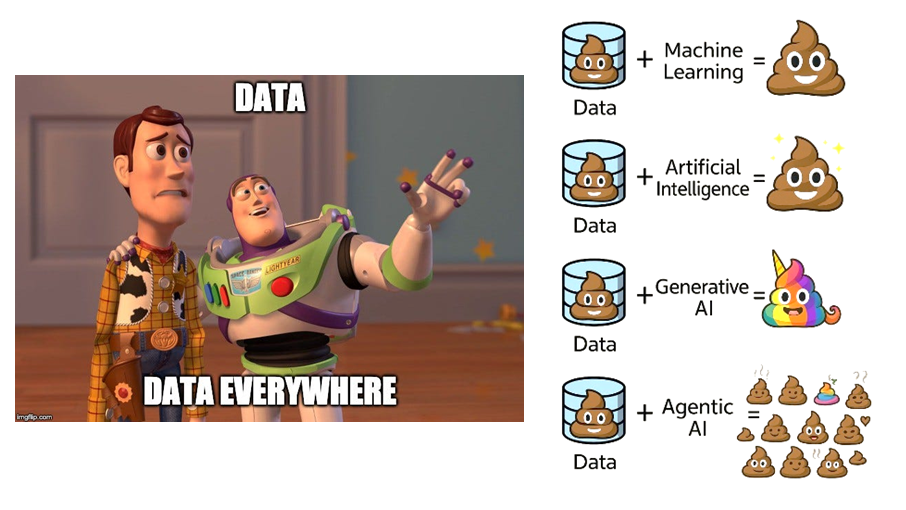
The ubiquity of data masks a critical quality problem. Each wave of technology, from machine learning to generative AI and now agentic systems, promises breakthroughs but often amplifies existing data quality issues. Poor data combined with sophisticated algorithms produces sophisticated garbage. Without rigorous attention to data quality and preparation, even the most advanced analytical techniques remain built on shaky foundations.
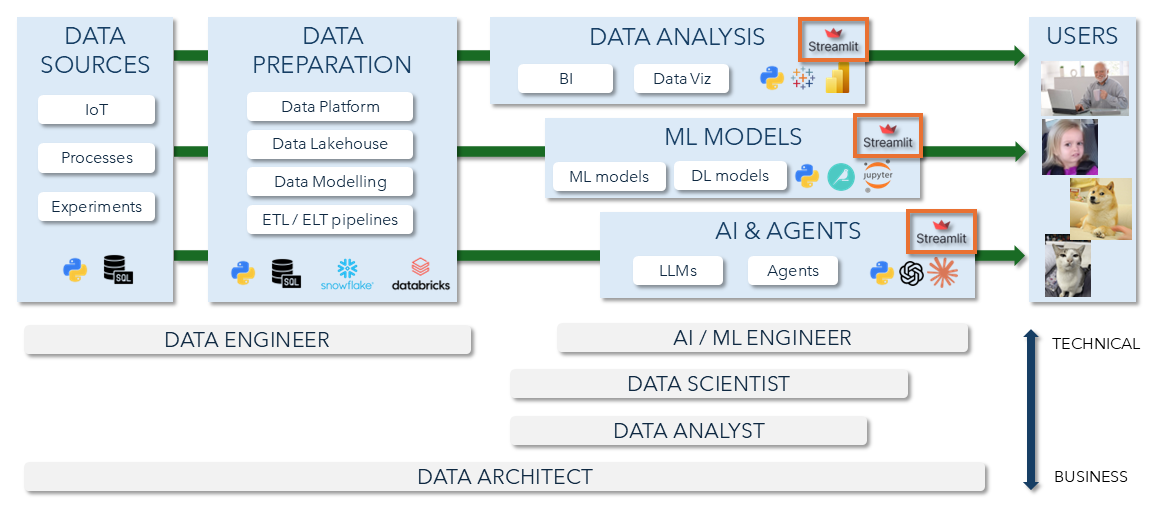
Modern data architectures address this through a clear flow: raw data sources feed into preparation layers where data engineers ensure quality and structure. From there, specialized tracks emerge. Data analysts produce business intelligence and visualizations. Data scientists build predictive models. AI engineers develop autonomous systems. Each track generates value, yet a critical gap persists at the endpoint.
The insights, models, and AI capabilities remain trapped in technical environments: Python scripts, Jupyter notebooks, complex APIs. Sharing requires either significant frontend development or resignation to static reports and meetings. This delivery bottleneck prevents organizations from realizing the full value of their data investments.
Streamlit bridges this final gap: it sits at the delivery layer, wrapping technical outputs in accessible, interactive interfaces. This positioning addresses the last step of the data journey, where technical work must transform into business value.
What is Streamlit?
Streamlit redefines how data professionals deliver interactive applications by integrating the presentation layer directly into Python. Instead of requiring developers to learn HTML, CSS, or JavaScript, it enables the creation of web apps using only Python scripts or notebooks. Streamlit automatically re-runs the relevant parts of the script and updates the interface. This approach aligns closely with how data scientists already work, extending their existing tools into shareable applications without forcing them into traditional web development paradigms.
Streamlit’s simplicity compounds into practical advantages. Developers can quickly build functional and interactive interfaces. Its strong open-source ecosystem provides a wealth of examples, community support, and integrations. Deployment is equally straightforward, flowing from local experimentation through version control to production without requiring specialized infrastructure or DevOps expertise.
The trade-off is deliberate. Streamlit sacrifices customization for dramatic reductions in development complexity and time. This exchange proves valuable for internal tools and prototypes but becomes limiting for customer-facing applications requiring extensive branding or complex interactions.

The value proposition: is it worth learning?
The decision to learn a new technology depends on its real-world impact: how it enhances one’s skills, aligns with career goals, and strengthens professional positioning. For Streamlit, the assessment is particularly relevant given its growing presence in data-driven industries.
Streamlit’s adoption reflects both scale and engagement. Over 500,000 developers use it monthly, supported by a community of 54,000 forum members and 40,000 GitHub stars. This active ecosystem demonstrates sustained interest and practical value, with an extensive App Gallery showcasing examples across sectors and problem types.
Its use cases fall into three main categories.
- Dashboards and visualizations are the most common, allowing analysts to share interactive insights quickly.
- Proof-of-concept apps highlight Streamlit’s strength in turning ideas into functional demos with minimal effort, ideal for model exploration or stakeholder presentations.
- Data applications extend functionality to tasks like monitoring data quality or serving model predictions.
However, Streamlit is not intended for complex, enterprise-grade web systems requiring advanced state management or heavy concurrency
Position in the data ecosystem
Streamlit acts as the connection point between complex data pipelines and the people who use their results. Data flows from sensors, processes, and experiments through preparation stages managed by data engineers, where platforms and pipelines shape raw information into usable form. From there, insights are delivered through three main tracks: data analysis, machine learning models, and AI or agent-based systems.
Streamlit possibly sits on each of these tracks. It powers dashboards and visual reports for analysts, provides interfaces for testing and deploying ML models, and enables interactive tools and chatbots for AI-driven applications.
By simplifying how technical work reaches business users, Streamlit helps bridge roles across the data ecosystem, from engineers to analysts and AI developers. While not built for large-scale enterprise deployment, its strength lies in rapid, accessible delivery of insights across diverse data workflows.
Bridging data and users
Role in your personal toolkit
Every data professional builds a toolkit possibly covering many aspects of the data process though emphasis varies by role.

Streamlit strengthens several of these competencies at once. It enhances communication for data analysts by turning results into interactive, shareable apps. It extends programming for data scientists by adding interface-building directly within Python. It advances data visualization through dynamic dashboards and supports machine learning for AI/ML engineers by simplifying model deployment and experimentation.
By supporting multiple skill areas, Streamlit works as a cross-role tool for data analysts, data scientists, and AI/ML engineers, fitting naturally into any data professional’s toolkit.
Comparative analysis: Streamlit vs. alternatives
Understanding any technology requires situating it within its competitive landscape. Streamlit competes with and complements several established alternatives, each with different strengths and trade-offs.
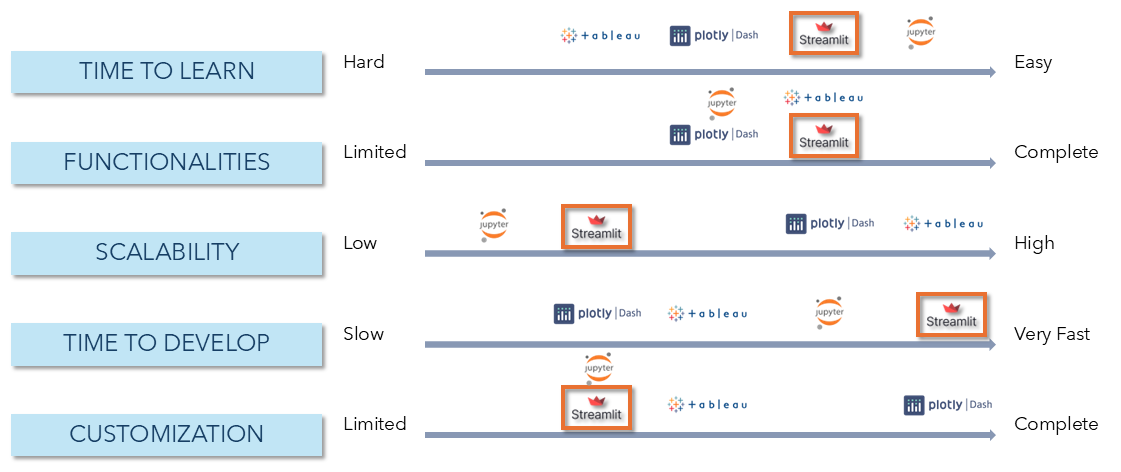
Streamlit stands out for its ease of learning and speed of development. Unlike Tableau or Plotly Dash, which require more setup and configuration, Streamlit feels natural to Python users and allows functional apps to be built in minutes.
In terms of functionality, Streamlit and Plotly Dash both support full application development, while Jupyter remains limited to exploration.
Its main trade-offs appear in scalability and customization: Streamlit performs best for small to medium deployments and offers fewer layout controls compared to Tableau or Dash.
Overall, Streamlit optimizes for simplicity and rapid iteration rather than enterprise-grade scalability or heavy branding, making it ideal for teams focused on prototyping, internal dashboards, and fast analytical delivery.
Conclusion: when to use Streamlit?
Streamlit deserves consideration as a practical addition to a data professional’s toolkit. It removes the need for front-end development, enabling analysts and data scientists to present insights interactively while staying within Python. Companies use it mainly for internal tools, dashboards, and proof-of-concepts rather than large-scale customer applications.
In summary, Streamlit excels in rapid prototyping, model deployment, and stakeholder communication — skills and functionalities valuable across data analyst, data scientist, and AI/ML engineer roles.
Learn Streamlit if you frequently share analytical results, prototype models, or build internal dashboards. However, if your work requires enterprise-grade scalability, complex branding, or large user concurrency, other frameworks may be better suited. Ultimately, Streamlit fills a critical gap between data analysis and interactive delivery, making it a focused, efficient tool for turning analytical code into usable applications.
Authors
Shinichi Okamura and Solange Flatt
Introduction: The data complexity challenge
In today's data-driven landscape, the real problem is data quality and accessibility, way more than data scarcity. Organizations drown in information yet struggle to transform it into actionable insights for end users.
The ubiquity of data masks a critical quality problem. Each wave of technology, from machine learning to generative AI and now agentic systems, promises breakthroughs but often amplifies existing data quality issues. Poor data combined with sophisticated algorithms produces sophisticated garbage. Without rigorous attention to data quality and preparation, even the most advanced analytical techniques remain built on shaky foundations.
Modern data architectures address this through a clear flow: raw data sources feed into preparation layers where data engineers ensure quality and structure. From there, specialized tracks emerge. Data analysts produce business intelligence and visualizations. Data scientists build predictive models. AI engineers develop autonomous systems. Each track generates value, yet a critical gap persists at the endpoint.
The insights, models, and AI capabilities remain trapped in technical environments: Python scripts, Jupyter notebooks, complex APIs. Sharing requires either significant frontend development or resignation to static reports and meetings. This delivery bottleneck prevents organizations from realizing the full value of their data investments.
Streamlit bridges this final gap: it sits at the delivery layer, wrapping technical outputs in accessible, interactive interfaces. This positioning addresses the last step of the data journey, where technical work must transform into business value.
What is Streamlit?
Streamlit redefines how data professionals deliver interactive applications by integrating the presentation layer directly into Python. Instead of requiring developers to learn HTML, CSS, or JavaScript, it enables the creation of web apps using only Python scripts or notebooks. Streamlit automatically re-runs the relevant parts of the script and updates the interface. This approach aligns closely with how data scientists already work, extending their existing tools into shareable applications without forcing them into traditional web development paradigms.
Streamlit’s simplicity compounds into practical advantages. Developers can quickly build functional and interactive interfaces. Its strong open-source ecosystem provides a wealth of examples, community support, and integrations. Deployment is equally straightforward, flowing from local experimentation through version control to production without requiring specialized infrastructure or DevOps expertise.
The trade-off is deliberate. Streamlit sacrifices customization for dramatic reductions in development complexity and time. This exchange proves valuable for internal tools and prototypes but becomes limiting for customer-facing applications requiring extensive branding or complex interactions.
The value proposition: is it worth learning?
The decision to learn a new technology depends on its real-world impact: how it enhances one’s skills, aligns with career goals, and strengthens professional positioning. For Streamlit, the assessment is particularly relevant given its growing presence in data-driven industries.
Streamlit’s adoption reflects both scale and engagement. Over 500,000 developers use it monthly, supported by a community of 54,000 forum members and 40,000 GitHub stars. This active ecosystem demonstrates sustained interest and practical value, with an extensive App Gallery showcasing examples across sectors and problem types.
Its use cases fall into three main categories.
- Dashboards and visualizations are the most common, allowing analysts to share interactive insights quickly.
- Proof-of-concept apps highlight Streamlit’s strength in turning ideas into functional demos with minimal effort, ideal for model exploration or stakeholder presentations.
- Data applications extend functionality to tasks like monitoring data quality or serving model predictions.
However, Streamlit is not intended for complex, enterprise-grade web systems requiring advanced state management or heavy concurrency
Position in the data ecosystem
Streamlit acts as the connection point between complex data pipelines and the people who use their results. Data flows from sensors, processes, and experiments through preparation stages managed by data engineers, where platforms and pipelines shape raw information into usable form. From there, insights are delivered through three main tracks: data analysis, machine learning models, and AI or agent-based systems.
Streamlit possibly sits on each of these tracks. It powers dashboards and visual reports for analysts, provides interfaces for testing and deploying ML models, and enables interactive tools and chatbots for AI-driven applications.
By simplifying how technical work reaches business users, Streamlit helps bridge roles across the data ecosystem, from engineers to analysts and AI developers. While not built for large-scale enterprise deployment, its strength lies in rapid, accessible delivery of insights across diverse data workflows.
Bridging data and users
Role in your personal toolkit
Every data professional builds a toolkit possibly covering many aspects of the data process though emphasis varies by role.
Streamlit strengthens several of these competencies at once. It enhances communication for data analysts by turning results into interactive, shareable apps. It extends programming for data scientists by adding interface-building directly within Python. It advances data visualization through dynamic dashboards and supports machine learning for AI/ML engineers by simplifying model deployment and experimentation.
By supporting multiple skill areas, Streamlit works as a cross-role tool for data analysts, data scientists, and AI/ML engineers, fitting naturally into any data professional’s toolkit.
Comparative analysis: Streamlit vs. alternatives
Understanding any technology requires situating it within its competitive landscape. Streamlit competes with and complements several established alternatives, each with different strengths and trade-offs.
Streamlit stands out for its ease of learning and speed of development. Unlike Tableau or Plotly Dash, which require more setup and configuration, Streamlit feels natural to Python users and allows functional apps to be built in minutes.
In terms of functionality, Streamlit and Plotly Dash both support full application development, while Jupyter remains limited to exploration.
Its main trade-offs appear in scalability and customization: Streamlit performs best for small to medium deployments and offers fewer layout controls compared to Tableau or Dash.
Overall, Streamlit optimizes for simplicity and rapid iteration rather than enterprise-grade scalability or heavy branding, making it ideal for teams focused on prototyping, internal dashboards, and fast analytical delivery.
Conclusion: when to use Streamlit?
Streamlit deserves consideration as a practical addition to a data professional’s toolkit. It removes the need for front-end development, enabling analysts and data scientists to present insights interactively while staying within Python. Companies use it mainly for internal tools, dashboards, and proof-of-concepts rather than large-scale customer applications.
In summary, Streamlit excels in rapid prototyping, model deployment, and stakeholder communication — skills and functionalities valuable across data analyst, data scientist, and AI/ML engineer roles.
Learn Streamlit if you frequently share analytical results, prototype models, or build internal dashboards. However, if your work requires enterprise-grade scalability, complex branding, or large user concurrency, other frameworks may be better suited. Ultimately, Streamlit fills a critical gap between data analysis and interactive delivery, making it a focused, efficient tool for turning analytical code into usable applications.
Authors
Shinichi Okamura and Solange Flatt